
📈 Numbers Don’t Lie: The True Story of BPL 2025
While fans cheered the sixes and dramatic finishes, BPL SPORT’s analytics team was quietly tracking the metrics that decided the season. From powerplay strike rates to bowling efficiency, the data reveals exactly why certain teams rose and others fell behind.
2025 proved once again:
T20 cricket is a numbers game — and the smartest teams win.
⚡ 1. Powerplay Advantage: The Opening Gambit
The first six overs shaped nearly 61% of match outcomes, according to BPL SPORT Probability Models.
🟢 Key Powerplay Metrics
| Metric | League Avg | Top 3 Teams | Bottom 3 Teams |
|---|---|---|---|
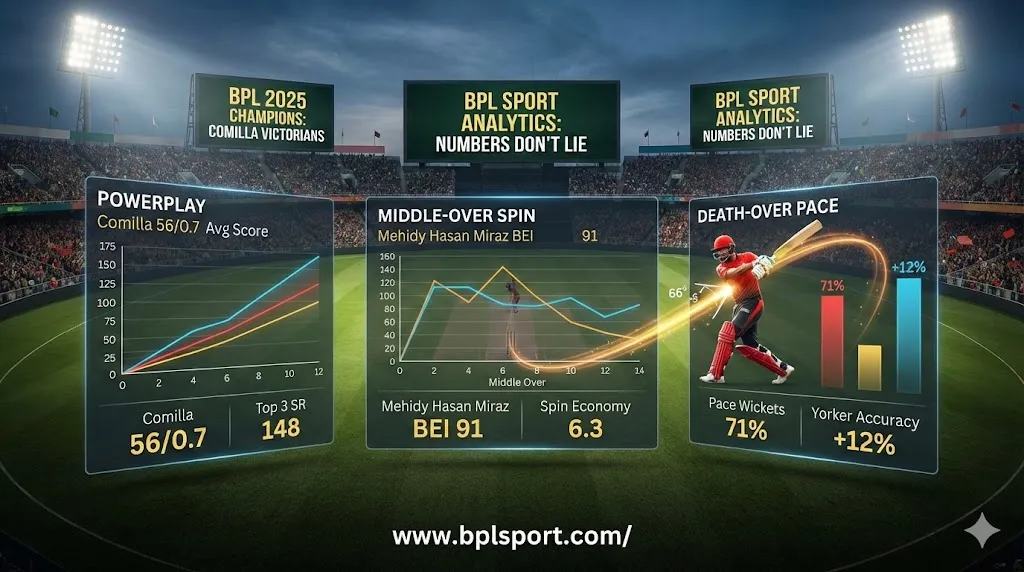
| Avg Powerplay Score | 47/1 | 56/0.7 | 39/1.6 |
| Strike Rate | 134 | 148 | 119 |
| Boundary % (Overs 1–6) | 42% | 51% | 32% |
Teams like Comilla Victorians consistently broke 50+ in powerplays — a major reason for their finals run.
“Powerplay aggression wasn’t reckless this year — it was controlled chaos.”
— BPL SPORT Analyst, Rahman Ali
👉 More powerplay analytics at BPLSPORT.com
🎯 2. Middle Overs: Spin Took Control
The data confirms it: middle-over spin was the backbone of BPL 2025.
Spinners delivered:
- 56% of all wickets between overs 7–14
- Avg economy: 6.3, lowest in 6 years
- Dot ball percentage: 47%
Top Middle-Over Bowlers (BPL SPORT Index)
| Player | Team | BEI Score |
|---|---|---|
| Mehidy Hasan Miraz | Barishal | 91 |
| Nasum Ahmed | Sylhet | 88 |
| Tanvir Islam | Comilla | 84 |
These middle-phase chokeholds flipped match momentum again and again.
🔥 3. Death Overs: Pacers Regained the Throne
Overs 16–20 belonged to the quicks.
Surprisingly, pace bowlers accounted for 71% of death-over wickets, reversing last year’s trend.
Death-Over Metrics
- Avg pace economy: 8.8
- Avg spin economy: 10.3
- Yorker accuracy improvement: +12% from 2024
- Slower-ball wickets: 23% of pace dismissals
Mustafizur Rahman, Taskin Ahmed, and Russell dominated this critical phase.
📊 Advanced death-over charts live on BPLSPORT.com
🧠 4. Batting Trends: Controlled Aggression Wins
This season wasn’t about mindless hitting — it was about timing chaos.
Big Picture Batting Trends
| Category | Value |
|---|---|
| League SR | 131 |
| Top team SR | 146 |
| Avg 1st-innings score | 168 |
| Successful chase rate | 58% (highest in BPL history) |
Batsmen adapted by:
- Picking specific bowlers to attack
- Targeting shorter boundaries
- Utilizing reverse sweeps & ramps early
- Rotating strike vs left-arm spin (significant improvement)
Liton Das, Hridoy, and Mushfiqur showcased elite adaptability.
🛡️ 5. Fielding Impact: The Invisible Difference
Fielding decided three matches directly, per win probability shifts tracked by BPL SPORT.
Key observations:
- Catch efficiency increased to 89% league average
- Direct-hit run outs rose by 21%
- Boundary saves saved teams an avg of 6.4 runs per match
These “hidden runs” mattered more than ever.
🧩 6. Team Efficiency Score (TES): Who Really Performed Best?
Using BPL SPORT’s composite metric (batting + bowling + fielding + tactical timing), the season’s top teams ranked:
🏆 BPL SPORT TES Rankings
- Comilla Victorians – 91
- Fortune Barishal – 88
- Sylhet Strikers – 84
- Rangpur Riders – 79
- Dhaka Dominators – 72
Comilla wasn’t just consistent — they were efficient, maximizing every over.
🔮 7. What the Numbers Predict for BPL 2026
From statistical modeling and pattern recognition, BPL SPORT forecasts:
- Teams will recruit more wrist spinners
- Powerplay strike rate will rise by 6–9%
- All-rounders with 130+ SR and sub-7 economy will define the next era
- Death-over bowling will rely heavily on cutters and slower-yorkers
- Analysts will become more involved in real-time decisions
Data isn’t just supporting cricket anymore —
it’s shaping it.
💬 Expert Commentary
“The more we decode T20, the more we realize it’s a game of small decisions disguised as big moments.”
— Tanvir Ahmed, BPL SPORT Chief Statistician
📚 FAQ
Q1. Which phase of innings was most decisive in BPL 2025?
The middle overs, where spin slowed scoring and created wicket pressure.
Q2. Did batting improve compared to 2024?
Yes, strike rates rose and finishing improved significantly due to better calculation of risk windows.
Q3. Which team had the best all-round balance?
Comilla Victorians, who topped the TES ranking with high efficiency across all departments.
Q4. Are BPL teams becoming more data-driven?
Absolutely — most teams used analytics to plan matchups, rotations, and field placements.
📍 Explore full match data, graphs, and insights at BPLSPORT.com
Next up:Dhaka Dominators Rebuild Plan for BPL 2026 🔧